Interactive exploration of multi-billion–row tables requires, such as Gaia’s tables, requires specialised visual analytics pipelines that precompute multiresolution representations and provide low-latency access on standard user hardware. Building on the Gaia Archive Visualisation Service (GAVS), we have extended this framework within SPACIOUS through a fully containerised, cloud-deployable architecture and a redesigned data-production pipeline. The refactored workflow improves memory efficiency, removes legacy format dependencies, and enables automated generation of visualisation products.
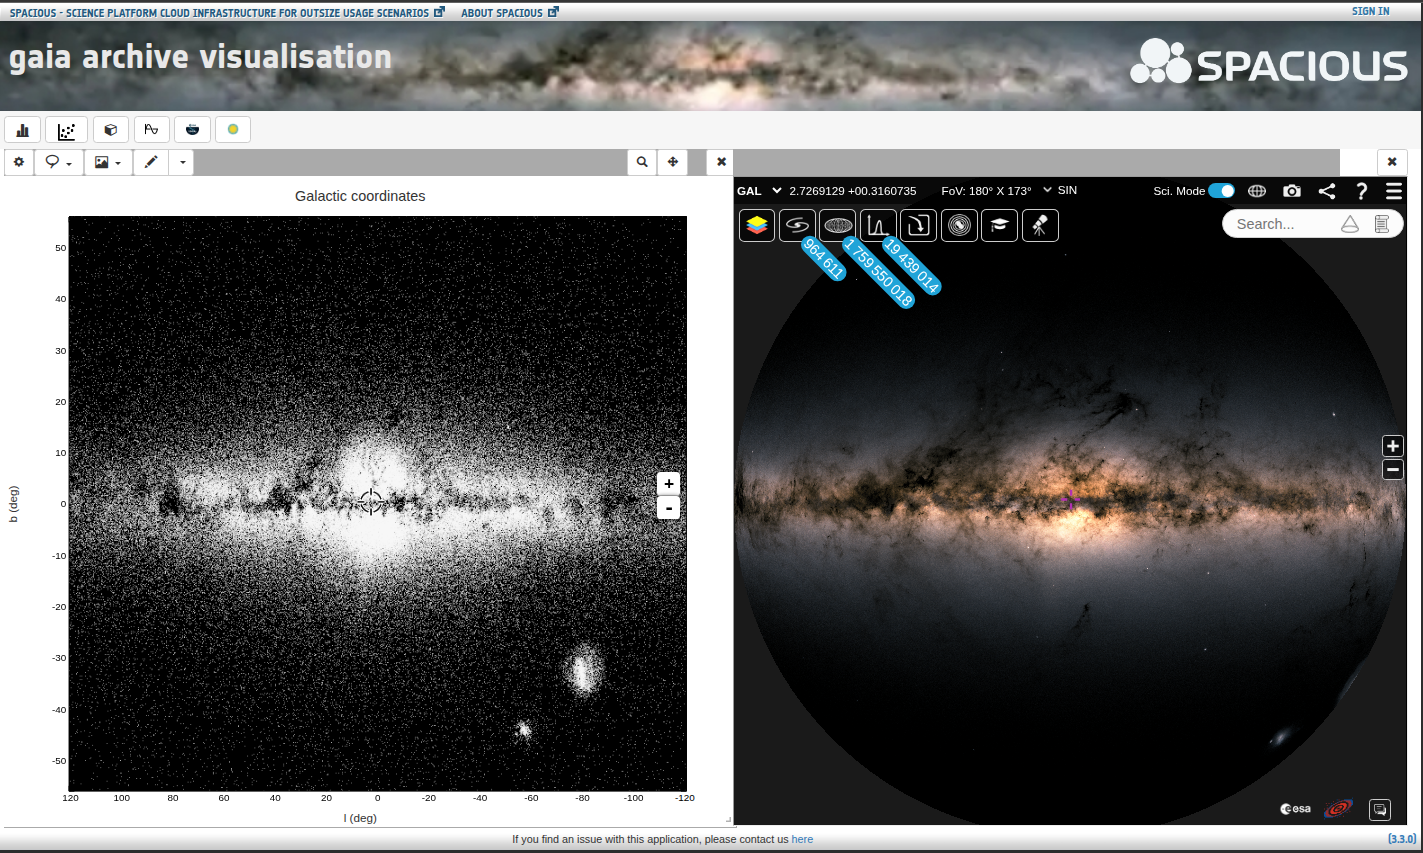
A major enhancement is support for user tables and arbitrary user-selected attribute combinations, replacing the fixed histogram and scatter-plot variable sets available in the current GAVS. This required updates to preprocessing, indexing, and metadata handling to maintain fast retrieval across the full parameter space of (Gaia) tables. Another enhancement has been the integration of ESASky with the aditional capability of displaying Gaia HiPS allsky maps (not offered in the current ESASky).
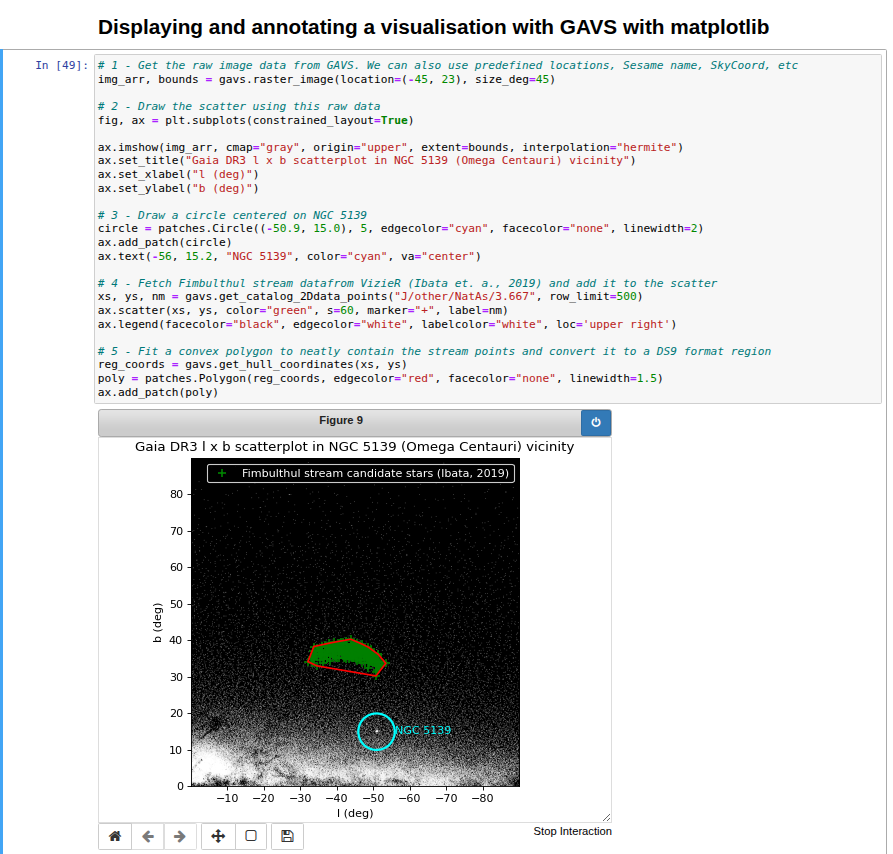
We also provide notebook integration (pyGAVS), allowing direct interaction with the visualisation server from Jupyter environments (illustrated in the image below) and supporting reproducible, analysis-driven workflows. These developments establish SPACIOUS as a flexible, high-performance platform for visual analytics on upcoming Gaia data releases.